41.可视化单细胞亚群的标记基因的5个方法
42.Cell Ranger软件的相关知识及用法
原理介绍1、原理介绍2、用法介绍1、Cell ranger使用前注意事项、Cell Ranger使用初探、Cell Ranger流程概览、理解cellranger count的结果
43.两种给细胞亚群重命名的方法
levels(seurat_integrated)
# Rename all identities
seurat_integrated <- RenameIdents(object = seurat_integrated,
                               "0" = "Naive or memory CD4+ T cells",
                               "1" = "CD14+ monocytes",
                               "2" = "Naive or memory CD4+ T cells",
                               "3" = "CD14+ monocytes",
                               "4" = "CD4+ T cells",
                               "5" = "CD8+ T cells",
                               "6" = "B cells",
                               "7" = "Stressed cells / Activated T cells",
                               "8" = "NK cells",
                               "9" = "FCGR3A+ monocytes",
                               "10" = "CD4+ T cells",
                               "11" = "B cells",
                               "12" = "NK cells",
                               "13" = "CD8+ T cells",
                               "14" = "CD14+ monocytes",
                               "15" = "Conventional dendritic cells",
                   "16" = "Megakaryocytes",
                   "17" = "B cells",
                   "18" = "CD4+ T cells",
                   "19" = "Plasmacytoid dendritic cells",
                   "20" = "Mast cells")
levels(seurat_integrated)
44. 探究已知的细胞类型marker
可以利用FeaturePlot()对细胞marker进行展示:
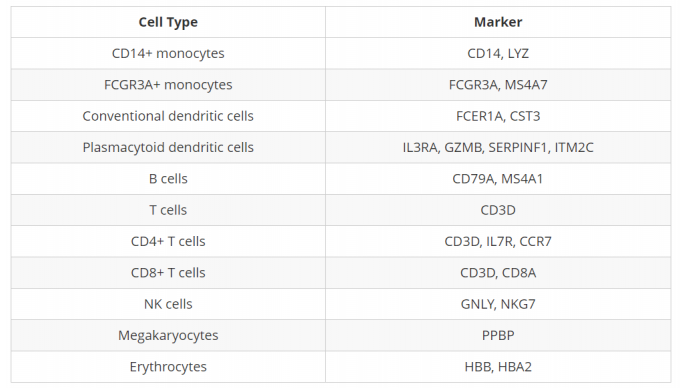
利用Seurat的FeaturePlot()函数可以轻松地在UMAP可视化上探索已知的标记,进而确定簇的身份。同时我们可以使用RNA assay slot中的标准化计数数据,来访问所有基因的表达水平(而不仅仅是3000个高度可变的基因)。
# Select the RNA counts slot to be the default assay
DefaultAssay(seurat_integrated) <- "RNA"

# Normalize RNA data for visualization purposes
seurat_integrated <- NormalizeData(seurat_integrated, verbose = FALSE)
同时还需要考虑簇与簇之间marker表达的一致性。例如,如果一个细胞类型有两个标记基因,而簇中仅表达了其中一个,那么我们就不能绝对地将该簇分配给该细胞类型。
45. 关于分cluster个数的说明(来自哈佛大学单细胞课程)
NOTE: If any cluster appears to contain two separate cell types, it’s helpful to increase our clustering resolution to properly subset the clusters. Alternatively, if we still can’t separate out the clusters using increased resolution, then it’s possible that we had used too few principal components such that we are just not separating out these cell types of interest. To inform our choice of PCs, we could look at our PC gene expression overlapping the UMAP plots and determine whether our cell populations are separating by the PCs included.
注意:如果任何一个簇似乎包含两种不同的细胞类型,那么增加我们的簇分辨率以正确地对簇进行子集划分是很有帮助的。或者,如果我们仍然不能使用更高的分辨率来分离出这些簇,那么我们可能使用了太少的主成分,这样我们就不能分离出这些感兴趣的细胞类型。为了给我们选择PCs提供信息,我们可以观察与UMAP图重叠的PC基因表达,并确定我们的细胞群是否被PCs分离。
46.为FindAllMarkers()函数鉴定出的基因添加基因注释(来自哈佛大学单细胞课程)
在列中添加基因注释信息,可以点击此处的链接下载注释文件到data文件夹。
annotations <- read.csv("data/annotation.csv")
NOTE: If you are interested in knowing how we obtained this annotation file, take a look at the linked materials(https://github.com/hbctraining/scRNA-seq/blob/master/lessons/fetching_annotations.md).
首先,将带有基因标识符的行名变成我们的列。然后将该注释文件与FindConservedMarkers()的结果合并:
# Combine markers with gene descriptions
cluster0_ann_markers <- cluster0_conserved_markers %>%
                rownames_to_column(var="gene") %>%
                left_join(y = unique(annotations[, c("gene_name", "description")]),
                          by = c("gene" = "gene_name"))

View(cluster0_ann_markers)
方法二:可以使用GeneCards这个数据库:https://www.genecards.org/
47提取细胞亚群
48.细胞亚群占比统计
#细胞亚群占比统计
cluster<-c("Cancer cell","Immune cell","Epithelial cells","Endothelial cells","Fibroblasts")

subset_cell<-c()
for (i in 1:5) {
  subset_cell=c(subset_cell,dim(tissu1[,Idents(tissu1)%in%c(cluster[i])])[2])
}

subset_account<-c()
total_cells<-dim(tissu1)[2]
for (i in 1:5) {
  subset_account=c(subset_account,subset_cell[i]/total_cells)
}

subset_account<-subset_account*100
per.cell <- paste(cluster,": ",ceiling(subset_account),"%",sep = "")
pie(subset_account,labels=per.cell)
49.使用SingleR预测细胞类型
50.人类基因综合数据库GeneCards
51.RunPCA时遇到error in irlba(A = t(x = object), nv = npcs, …)
pbmc <- RunPCA(pbmc, features = VariableFeatures(object = pbmc))

Error in irlba(A = t(x = object), nv = npcs, ...) : max(nu, nv) must be strictly less than min(nrow(A), ncol(A))
简单来说就是你的细胞数小于50。 npcs的选择是默认为50。PC当然要小于矩阵的行数或列数中的最小值。所以只需修改默认值即可。
解决方案:
pbmc <- RunPCA(pbmc, npcs = 33(填“细胞数-1”),features = VariableFeatures(object = pbmc))
52.与 Seurat 对象交互的功能
1.How many cells are in each replicate?
table(pbmc$replicate)

##
## rep1 rep2
## 1348 1290
2.# What proportion of cells are in each cluster?
prop.table(table(Idents(pbmc)))

##
##  Naive CD4 T Memory CD4 T   CD14+ Mono            B        CD8 T FCGR3A+ Mono
##  0.264215315  0.183093252  0.181956027  0.130401820  0.102729340  0.061410159
##           NK           DC     Platelet
##  0.058756634  0.012130402  0.005307051
3.How does cluster membership vary by replicate?
table(Idents(pbmc), pbmc$replicate)

##
##                rep1 rep2
##   Naive CD4 T   354  343
##   Memory CD4 T  249  234
##   CD14+ Mono    232  248
##   B             173  171
##   CD8 T         154  117
##   FCGR3A+ Mono   81   81
##   NK             81   74
##   DC             18   14
##   Platelet        6    8

prop.table(table(Idents(pbmc), pbmc$replicate), margin = 2)

##
##                       rep1        rep2
##   Naive CD4 T  0.262611276 0.265891473
##   Memory CD4 T 0.184718101 0.181395349
##   CD14+ Mono   0.172106825 0.192248062
##   B            0.128338279 0.132558140
##   CD8 T        0.114243323 0.090697674
##   FCGR3A+ Mono 0.060089021 0.062790698
##   NK           0.060089021 0.057364341
##   DC           0.013353116 0.010852713
##   Platelet     0.004451039 0.006201550
4.What are the cell names of all NK cells?
WhichCells(pbmc, idents = "NK")

##   [1] "AAACCGTGTATGCG" "AAATTCGATTCTCA" "AACCTTACGCGAGA" "AACGCCCTCGTACA"
##   [5] "AACGTCGAGTATCG" "AAGATTACCTCAAG" "AAGCAAGAGCTTAG" "AAGCAAGAGGTGTT"
##   [9] "AAGTAGGATACAGC" "AATACTGAATTGGC" "AATCCTTGGTGAGG" "AATCTCTGCTTTAC"
##  [13] "ACAAATTGTTGCGA" "ACAACCGAGGGATG" "ACAATTGATGACTG" "ACACCCTGGTGTTG"
##  [17] "ACAGGTACTGGTGT" "ACCTGGCTAAGTAG" "ACGAACACCTTGTT" "ACGATCGAGGACTT"
##  [21] "ACGCAATGGTTCAG" "ACGCTGCTGTTCTT" "ACGGAACTCAGATC" "ACGTGATGTGACAC"
##  [25] "ACGTTGGAGCCAAT" "ACTGCCACTCCGTC" "ACTGGCCTTCAGTG" "ACTTCAACGTAGGG"
##  [29] "AGAACAGAAATGCC" "AGATATACCCGTAA" "AGATTCCTGTTCAG" "AGCCTCTGCCAATG"
##  [33] "AGCGATTGAGATCC" "AGGATGCTTTAGGC" "AGGGACGAGTCAAC" "AGTAATACATCACG"
5.How can I extract expression matrix for all NK cells (perhaps, to load into another package)
nk.raw.data <- as.matrix(GetAssayData(pbmc, slot = "counts")[, WhichCells(pbmc, ident = "NK")])
6.Can I create a Seurat object based on expression of a feature or value in object metadata?
subset(pbmc, subset = MS4A1 > 1)

## An object of class Seurat
## 13714 features across 414 samples within 1 assay
## Active assay: RNA (13714 features, 2000 variable features)
##  2 dimensional reductions calculated: pca, umap

subset(pbmc, subset = replicate == "rep2")

## An object of class Seurat
## 13714 features across 1290 samples within 1 assay
## Active assay: RNA (13714 features, 2000 variable features)
##  2 dimensional reductions calculated: pca, umap
7.Can I create a Seurat object of just the NK cells and B cells?
subset(pbmc, idents = c("NK", "B"))

## An object of class Seurat
## 13714 features across 499 samples within 1 assay
## Active assay: RNA (13714 features, 2000 variable features)
##  2 dimensional reductions calculated: pca, umap
8.Can I create a Seurat object of all cells except the NK cells and B cells?
subset(pbmc, idents = c("NK", "B"), invert = TRUE)

## An object of class Seurat
## 13714 features across 2139 samples within 1 assay
## Active assay: RNA (13714 features, 2000 variable features)
##  2 dimensional reductions calculated: pca, umap

# note that if you wish to perform additional rounds of clustering after subsetting we recommend
# re-running FindVariableFeatures() and ScaleData()
9.How can I calculate the average expression of all cells within a cluster?
cluster.averages <- AverageExpression(pbmc)
head(cluster.averages[["RNA"]][, 1:5])

##               Naive CD4 T Memory CD4 T CD14+ Mono          B      CD8 T
## AL627309.1    0.006128664  0.005927264 0.04854338 0.00000000 0.02054586
## AP006222.2    0.000000000  0.008206078 0.01088471 0.00000000 0.01191488
## RP11-206L10.2 0.007453092  0.000000000 0.00000000 0.02065031 0.00000000
## RP11-206L10.9 0.000000000  0.000000000 0.01050116 0.00000000 0.00000000
## LINC00115     0.019118933  0.024690483 0.03753737 0.03888541 0.01948277
## NOC2L         0.497463190  0.359811462 0.27253750 0.58653489 0.55704897

# Return this information as a Seurat object (enables downstream plotting and analysis) First,
# replace spaces with underscores '_' so ggplot2 doesn't fail
orig.levels <- levels(pbmc)
Idents(pbmc) <- gsub(pattern = " ", replacement = "_", x = Idents(pbmc))
orig.levels <- gsub(pattern = " ", replacement = "_", x = orig.levels)
levels(pbmc) <- orig.levels
cluster.averages <- AverageExpression(pbmc, return.seurat = TRUE)
cluster.averages

## An object of class Seurat
## 13714 features across 9 samples within 1 assay
## Active assay: RNA (13714 features, 0 variable features)
10.How can I plot the average expression of NK cells vs. CD8 T cells?
# Pass do.hover = T for an interactive plot to identify gene outliers

CellScatter(cluster.averages, cell1 = "NK", cell2 = "CD8_T")
11.How can I calculate expression averages separately for each replicate?
cluster.averages <- AverageExpression(pbmc, return.seurat = TRUE, add.ident = "replicate")

CellScatter(cluster.averages, cell1 = "CD8_T_rep1", cell2 = "CD8_T_rep2")

# You can also plot heatmaps of these 'in silico' bulk datasets to visualize agreement between replicates

DoHeatmap(cluster.averages, features = unlist(TopFeatures(pbmc[["pca"]], balanced = TRUE)), size = 3,
    draw.lines = FALSE)
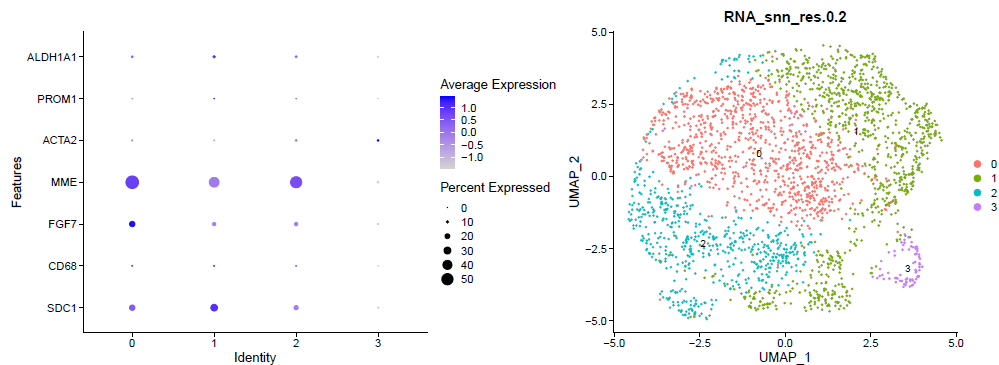
53.cluster分群四部曲:umap+dotplot+heatmap+clusterProfiler
(1)第一、二步:对降维后的数据进行umap可视化,并使用dotplot函数,绘制每个cluster的top feature
sce.all=CreateSeuratObject(Read10X_h5('GSM4592552_filtered_gene_bc_matrices_h5.h5'))

sce.all.filt=sce.all
sce.all.filt = FindVariableFeatures(sce.all.filt)
sce.all.filt = ScaleData(sce.all.filt,
                         vars.to.regress = c("nFeature_RNA", "percent_mito"))
sce.all.filt = RunPCA(sce.all.filt, npcs = 20)
sce.all.filt = RunTSNE(sce.all.filt, npcs = 20)
sce.all.filt = RunUMAP(sce.all.filt, dims = 1:20)

sce.all=sce.all.filt
sce.all <- FindNeighbors(sce.all, dims = 1:10)
sce.all <- FindClusters(sce.all, resolution = 0.2)
names(sce.all@reductions)
colnames(sce.all@meta.data)

colnames(sce.all@meta.data)
Idents(sce.all)="RNA_snn_res.0.2"

sce.all@active.ident
DimPlot(sce.all, reduction = "umap",label = T, )
ggsave('umap_by_seurat_clusters_res_0.2.png')
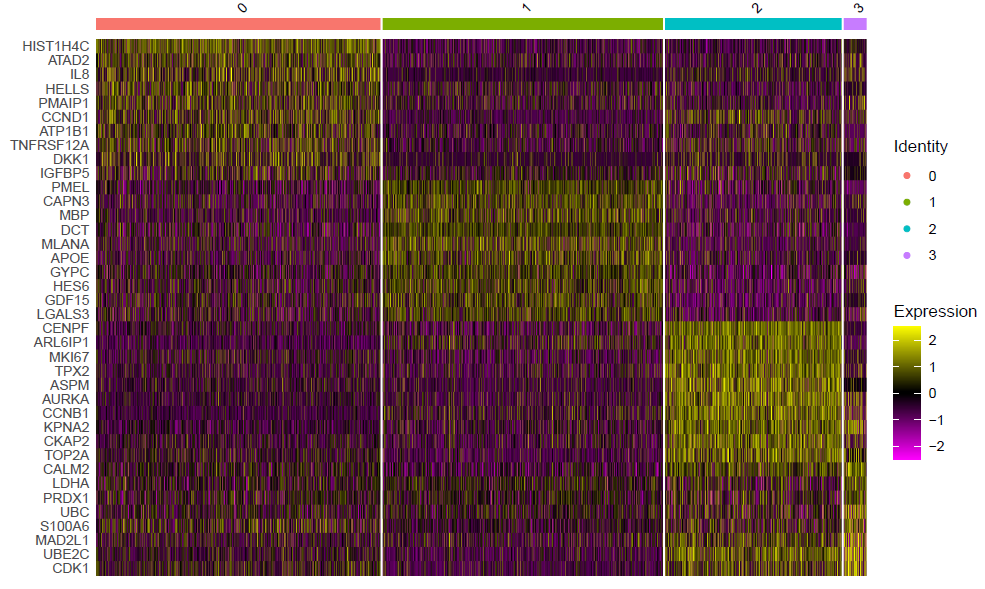
(2)第三步:使用DoHeatmap函数绘制top10基因的表达热图
table(Idents(sce))
sce.markers <- FindAllMarkers(object = sce, only.pos = TRUE, min.pct = 0.25,
                              thresh.use = 0.25)
DT::datatable(sce.markers)

pro='RNA_snn_res.0.2'
write.csv(sce.markers,file=paste0(pro,'_sce.markers.csv'))
library(dplyr)
top10 <- sce.markers %>% group_by(cluster) %>% top_n(10, avg_log2FC)
DoHeatmap(sce,top10$gene,size=3)
ggsave(filename=paste0(pro,'_sce.markers_heatmap.pdf'))

library(dplyr)
top3 <- sce.markers %>% group_by(cluster) %>% top_n(3, avg_log2FC)
DoHeatmap(sce,top3$gene,size=3)
ggsave(paste0(pro,'DoHeatmap_check_top3_markers_by_clusters.pdf'))
p <- DotPlot(sce, features = unique(top3$gene),
             assay='RNA'  )  + coord_flip()

p
ggsave(paste0(pro,'DotPlot_check_top3_markers_by_clusters.pdf'))
save(sce.markers,file = 'sce.markers.Rdata')
(4)第四步:使用clusterProfiler的compareCluster函数鉴定每个cluser的生物学功能
load(file = 'sce.markers.Rdata')
table(sce.markers$cluster)
library(clusterProfiler)
library(org.Hs.eg.db)
library(ggplot2)
ids=bitr(sce.markers$gene,'SYMBOL','ENTREZID','org.Hs.eg.db')
sce.markers=merge(sce.markers,ids,by.x='gene',by.y='SYMBOL')
gcSample=split(sce.markers$ENTREZID, sce.markers$cluster)
gcSample # entrez id , compareCluster
xx <- compareCluster(gcSample, fun="enrichKEGG",
                     organism="hsa", pvalueCutoff=0.05)
p=dotplot(xx)
p+ theme(axis.text.x = element_text(angle = 45,
                                    vjust = 0.5, hjust=0.5))
p

ggsave('compareCluster-sce.markers.pdf')